What is the purpose of a Flowchart?
The purpose of a Flowchart is to showcase the sequence of activities in a process and who is responsible for those activities; It enables persons to evaluate the flow of data by graphical representation.
How to make a Flowchart in PowerPoint
To create a Flowchart in Microsoft PowerPoint, follow the steps below: Launch PowerPoint First, we will turn the slide into a Blank Slide layout. Then we will add Gridlines to it. It is best to add Gridlines to the slide to size and lineup objects neatly in your presentation. Now add an Oval shape to the slide. The Oval ( Terminal) shape in flowcharts represents the Start or End point of a process.
To add an Oval shape to the slide, go to the Insert tab and click the Shapes button in the Illustration group. A list of shapes will pop up in the drop-down menu; select Oval in the Basic Shapes group.
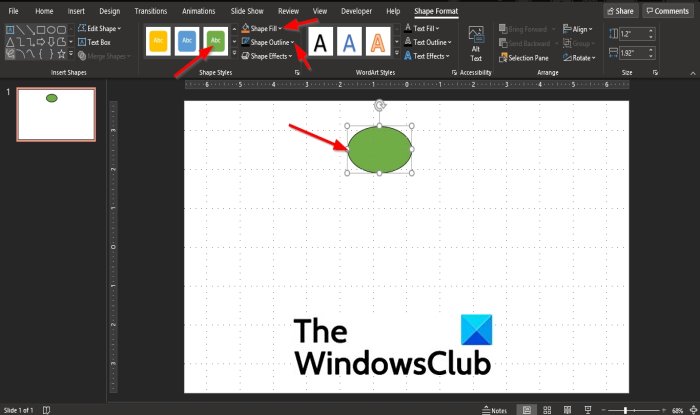
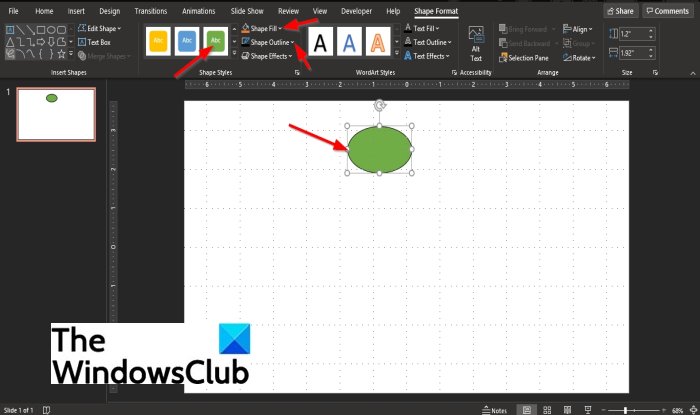
Draw the Oval Shape on the slide. A Shape Format tab will pop up on the menu bar. You can use this tab to customize your shape.
We want to change the color of the shape. On the Shape Format tab, you can change the shape’s color by clicking the Colored Fill displays or clicking the Shape Fill button in the Shape Styles group, and you can also change the shape outline color by clicking the Shape Outline button in the Shapes Styles group.
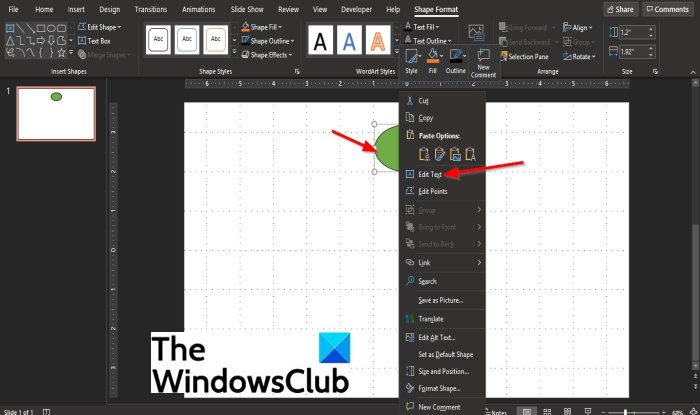
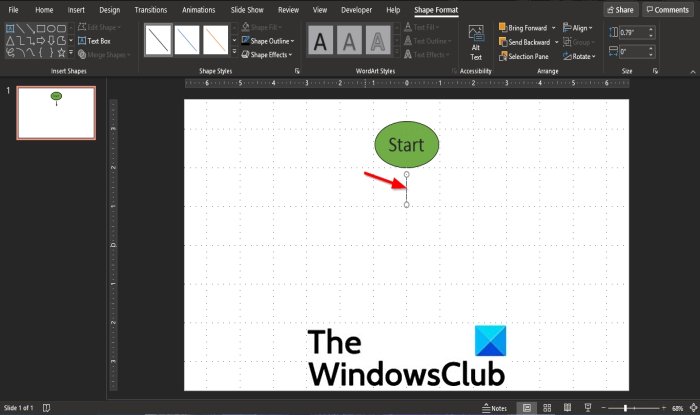
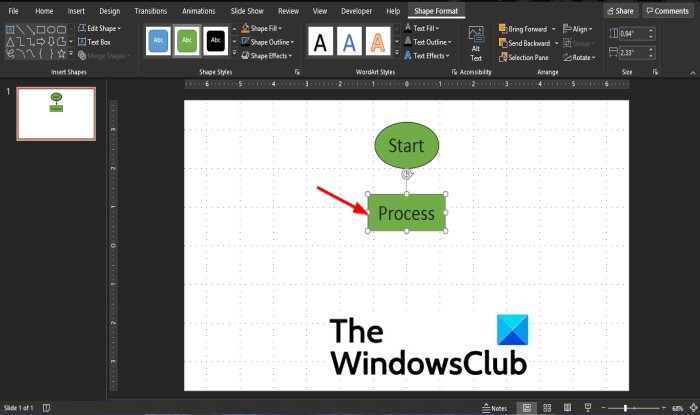
To add text to the shape, right-click the shape and select Edit Text; now edit the shape. Now we will draw a line. The Line (Flowline) connects different steps or processes or showcases the process order of operation. On the Insert tab in the Illustration group, click the Shapes button. Select a Line from the menu.
Draw the Line on the slide connecting it to the oval shape (terminal). When the Format Shape tab pops up, you can change the color of the Line. On the Insert tab in the Illustration group, click the Shapes button and select a Rectangle. The Rectangle (Process) represents a set of operations that changes data’s form, value, or location.
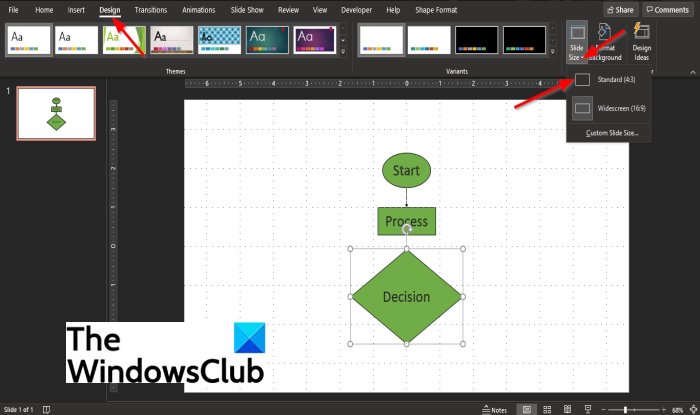
Draw the Rectangle in the slide connecting it to the Line. Right-click the shape and select Edit Text; to edit the shape. Draw another line connecting it to the Rectangle On the Insert tab in the Illustration group, click the Shapes button. Select from the drop-down menu Diamond in the Basic shapes group.
Draw the Diamond shape on the slide connecting it to the Line. Add color to shape, shape outline, and edit the shape. We want enough space on our slide because we want to add more shapes to it.
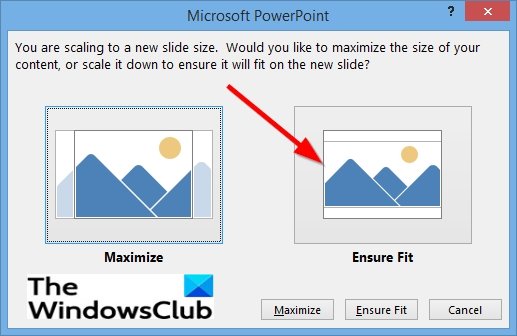
To increase the slide size; Click The Design tab and click Slide Size in the Customize group. Select Standard from the drop-down menu. A Microsoft PowerPoint dialog box will appear; select Ensure Fit.
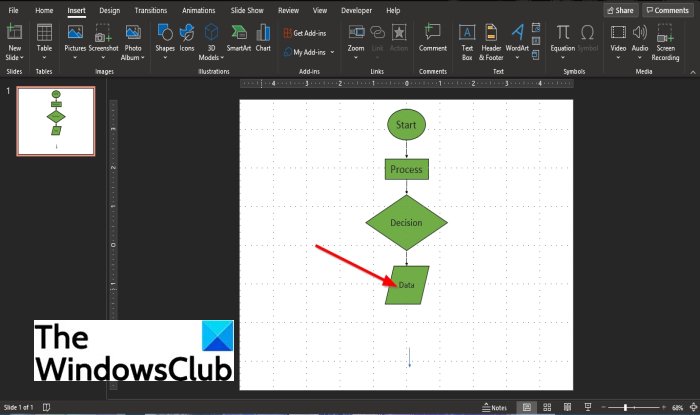
You will notice that the diagram is fitted to the slide with enough space. Organize the diagram on the slide. We will add another Line connecting it to the Diamond. Now we will add a Rhomboid (input / Output) in the slide; it represents the process of inputting and outputting data On the Insert tab in the Illustration group, click the Shapes button. Select from the drop-down menu Flowchart: Data in the Flowchart group.
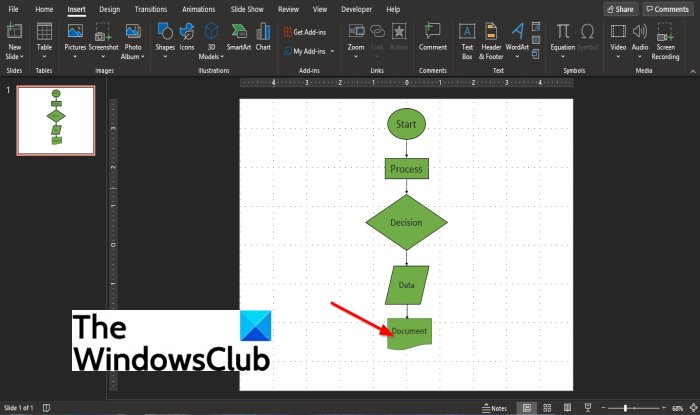
Draw the Flowchart: Data shape in the slide connecting it to the Line. Add color to shape, shape outline, and edit the shape. Add a Line and connect it to the Flowchart: Data shape. On the Insert tab in the Illustration group, click the Shapes button. Select from the drop-down menu Flowchart: Document in the Flowchart group.
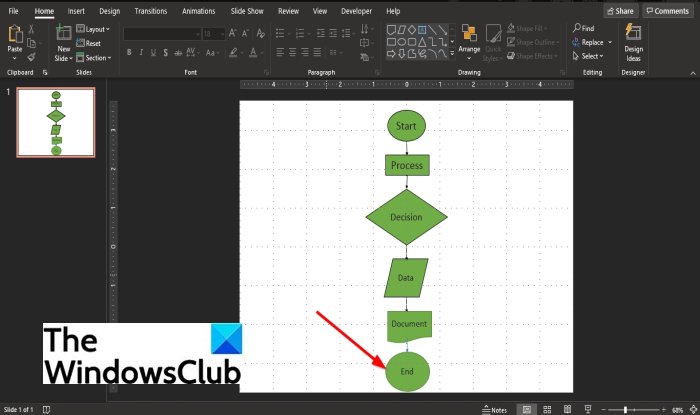
Draw the Flowchart: Document shape on the slide and connect it to the Line. Add color to shape, shape outline, and edit the shape. Draw another line and connect it to the Flowchart: Document shape Finally, we will add another Oval shape (terminal). On the Insert tab in the Illustration group, click the Shapes button. Select from the drop-down menu the Oval shape in the Basic Shapes group.
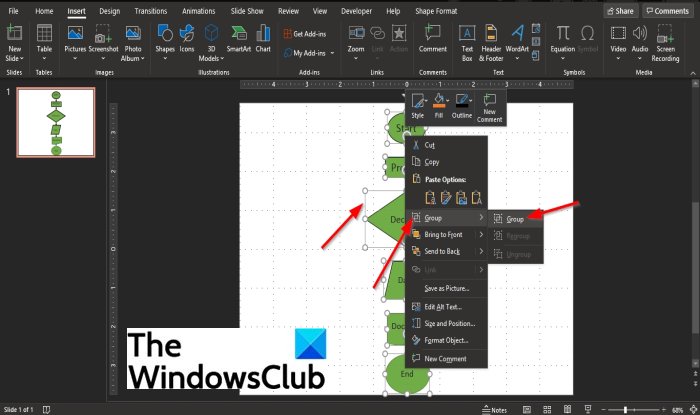
Draw the Oval Shape on the slide connecting it to the Line. Add color to shape, shape outline, and edit the shape. The oval shape is the end of the process of the diagram. Now we will group the shapes as one.
Hold the Shift key down to select all the shapes. Then right-click the shapes and select Group from the context menu, and then click Group. The shapes are joined together. We have a Flowchart.
What are the benefits of Flowchart?
Although Flowchart is a graphical representation of a data flow, it provides several benefits such as problem-solving, visual clarity, instant communication, practical analysis, and effective coordination. We hope this tutorial helps you understand how to make a Flowchart in PowerPoint; if you have questions about the tutorial, let us know in the comments.